
By Collo on Mar 13, 2026

Most dairy and beverage plants still rely on sensors that measure one or two parameters in clear liquids. They drift, foul in contact with product, and cannot see through opaque liquids like milk, cream or juice with pulp. Plants compensate with margins for error that waste water, chemicals, time and product.
The sensor landscape has changed. There are now six distinct measurement technologies available, each with fundamentally different strengths and limitations. This guide compares them all side by side.
Last updated 28 October 2026.
The six measurement technologies
Conductivity
Conductivity sensors measure the ability of a liquid to conduct electrical current, indicating ion concentration changes. Low-cost and simple to install, but limited to one parameter with significant drift requiring weekly to monthly recalibration. Cannot differentiate between liquids with similar conductivity, a common problem during CIP phase transitions. Manufacturers include Endress+Hauser, ifm, and Mettler Toledo.
Turbidity
Turbidity sensors measure how light is scattered by particles suspended in a liquid. Useful for detecting phase changes in clear liquids, but they rely on light transmission and cannot measure through opaque liquids at all. Sensor windows foul quickly in dairy applications. Manufacturers include Anderson-Negele, Satron, and Endress+Hauser.
Refractometry (Refractive Index)
Refractometers measure the refractive index at the sensor prism surface, correlating with total dissolved solids. Not affected by opacity, viscosity, colour, particulate, bubbles, flow or pressure, which makes it robust for Brix measurement in beverages.
However, the refractive index sums all dissolved matter into a single value and cannot distinguish between different solutes. It is less sensitive to ionic substances such as CIP chemical residues. Fat content above approximately 5% causes interference from optically active fat colloids, and certain products like quark yield unreliable results. Refractometry is expensive to deploy at scale, a key reason it has not been widely adopted in dairy. Manufacturers include Vaisala, Anton Paar, Maselli, and Atago.
UV-VIS Spectroscopy
UV-VIS spectroscopy analyses the light absorption spectrum of a liquid at ultraviolet and visible wavelengths. Good precision and specificity for clear liquids, but cannot measure through opaque liquids, struggles with fat and protein in dairy, and has limited real-time automation capability. Manufacturers include Anton Paar, AMETEK, and Endress+Hauser.
Laboratory Analysis (EMF / NIR-FTIR)
Laboratory instruments using electromagnetic field measurement or near-infrared spectroscopy provide the highest precision available, but they are not inline. Results arrive hours or days after the measurement was needed, making them unsuitable for real-time process control. Manufacturers include Speag, Keysight (EMF), FOSS, Bruker, and Thermo Fisher (spectroscopic).
RF Dielectric Measurement (Collo)
RF dielectric measurement sends radio frequency electromagnetic fields into the liquid and analyses the dielectric response across multiple frequencies. The RF sensor inside the Collo Analyzer creates a multi-parameter fingerprint of the liquid, which follows changes in composition, concentration, contamination and phase transitions simultaneously.
Three things set it apart from every other inline technology. The analyzer holds its reference without drift, because RF fields pass through product buildup. It reads several parameters from a single sensor where others measure one or two. And it works in opaque liquids like milk, cream and chocolate just as it does in water.
RF dielectric measurement is the core technology behind Collo's liquid process intelligence platform.
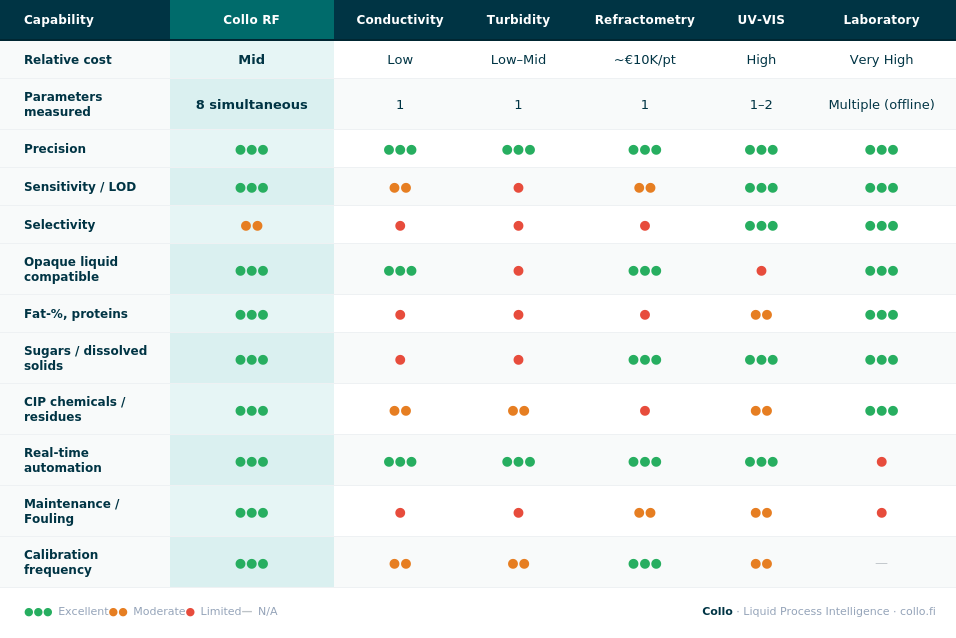
The comparison matrix as a table
The same comparison in text form. Excellent, moderate and limited are the three ratings used in the matrix above.
| Capability | Collo RF dielectric | Conductivity | Turbidity | Refractometry | UV-VIS | Laboratory |
|---|---|---|---|---|---|---|
| Relative cost | Mid | Low | Low to mid | About 10,000 euros per point | High | Very high |
| Parameters measured | 8 simultaneous | 1 | 1 | 1 | 1 to 2 | Multiple (offline) |
| Precision | Excellent | Excellent | Excellent | Excellent | Excellent | Excellent |
| Sensitivity / LOD | Excellent | Moderate | Limited | Moderate | Excellent | Excellent |
| Selectivity | Moderate | Limited | Limited | Limited | Excellent | Excellent |
| Opaque liquid compatible | Excellent | Excellent | Limited | Excellent | Limited | Excellent |
| Fat-%, proteins | Excellent | Limited | Limited | Limited | Moderate | Excellent |
| Sugars / dissolved solids | Excellent | Limited | Limited | Excellent | Excellent | Excellent |
| CIP chemicals / residues | Excellent | Moderate | Moderate | Limited | Moderate | Excellent |
| Real-time automation | Excellent | Excellent | Excellent | Excellent | Excellent | Limited |
| Maintenance / fouling | Excellent | Limited | Limited | Moderate | Moderate | Limited |
| Calibration frequency | Excellent | Moderate | Moderate | Excellent | Moderate | Not applicable |
Unlike conductivity sensors, which measure one parameter, or refractometers, which sum all dissolved matter into a single value, RF dielectric sensors measure several parameters simultaneously, providing a fingerprint rather than a single data point.
What makes RF dielectric measurement different
The comparison matrix reveals a pattern: most inline measurement technologies excel at one or two things but fall short in others. Conductivity is cheap but limited. Refractometry is robust for dissolved solids but not selective and expensive at scale. Spectroscopy is precise but cannot handle opaque liquids.
RF dielectric measurement works on a fundamentally different principle. Rather than relying on light or simple electrical properties, it analyses the dielectric response of a liquid across multiple radio frequencies. This has three practical consequences.
No fouling, no drift.
RF fields pass through product buildup on sensor surfaces. There are no optical windows to coat, no electrodes to corrode. The analyzer is calibrated during installation and holds its reference without drift, which removes the biggest source of ongoing cost with conventional sensors.
Several parameters from one sensor.
Where other inline technologies give you one data point, Collo's approach gives you a fingerprint: Collo Permittivity and Collo Ion Viscosity, combined into HydroGap, plus process temperature, all measured in real time.
Every liquid, every time.
The measurement works in whole milk, cream, chocolate and concentrated cleaning chemicals as it does in water. No sensor swaps and no drift.
CIP: where sensor choice has a big impact
CIP (Clean-In-Place) takes a large share of production time in dairy and beverage plants. Much of that time is driven by sensor uncertainty: conductivity cannot detect all phase transitions, and refractometers are less sensitive to ionic CIP chemicals. The standard response is to run every phase longer than necessary, as a margin for error.
Collo detects exact phase transitions throughout the entire CIP cycle, enabling automated, optimised cycles with no margin-for-error padding. Customers save 15 to 20% of CIP water and time this way.
Changeover: the other major cost driver
Changeovers, the transitions between products or between product and water, are responsible for some of the largest hidden losses in dairy and beverage manufacturing. A timing error of just a few seconds means product goes down the drain or gets diluted. Traditional sensors cannot detect these interfaces reliably: flow meters lack precision, conductivity and turbidity sensors cannot distinguish between similar liquids, and the losses are invisible inside steel pipes.
Collo detects the exact product-water interface in real time, enabling valve automation based on actual product detection rather than estimated timing. At Valio's Joensuu dairy, pushouts adjusted on Collo's interface analysis cut pushout losses by 92% on one cream line.
The bottom line
No single sensor technology is right for every application. The right choice depends on what you are measuring, what liquids are involved, and what you are optimising for. What has changed is that there are now options beyond the conductivity and optical sensors that have dominated for decades, and the differences in capability, maintenance, and total cost of ownership are significant.
If you want to go deeper, we have published a comprehensive Technology Comparison Guide covering all six technologies in detail, including a 5-year TCO analysis and a decision framework.
Want to explore what RF technology could do at your plant? We'd love to help you optimise your processes.
ColloidTek in China – integrating global innovation resources in Nanjing Tech Week

Collo in Stream Startup Festival 2019
