<img height="1" width="1" style="display:none" src="https://www.facebook.com/tr?id=1446880727106160&amp;ev=PageView&amp;noscript=1">
Changeover optimisation

Stop losing product. Maximise profits.

Real-time interface detection to eliminate product loss, boost yields, and turn sustainability into ROI. The calculator shows how much product your plant is losing and what it is costing you.


Challenges we solve

Hidden losses are costing you a fortune

Every changeover quietly drains profits, product, and sustainability from your operation.

Traditional detection methods (flow meters, and conductivity and turbidity sensors) fall short in accuracy and reliability in detecting the product/water/product interfaces, creating invisible losses that quickly add up.

It's an industry-wide blind spot, eating into your bottom line and your sustainability targets.

The loss calculator puts a number on it: how much product your plant is losing and what it is costing you.

Collo-S-2025-1738 edited optimized

From hidden losses to full control

Collo’s groundbreaking technology turns invisible losses into profit.

Collo Insights

Intelligence you can act on

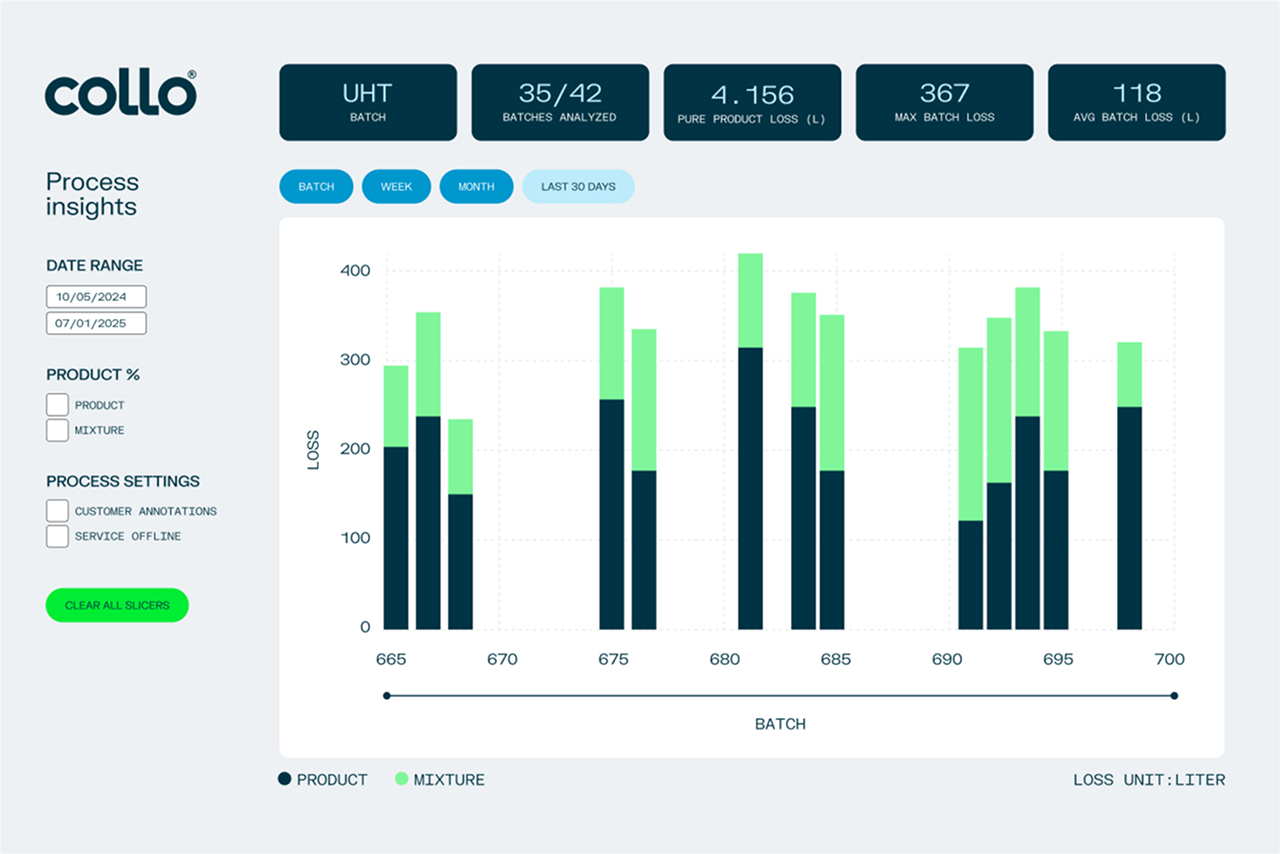
Monitor all changeovers continuously. Analytics dashboards show exactly where product ends and water/product begins. Recommendations for tuning your automation to reduce losses.

Typical results:

  • 15–20% savings identified
  • Clear automation tuning recommendations
  • Continuous anomaly detection
  • Annual savings

Collo Signals

Real-time process intelligence for automation

Turn clarity into action. Intelligent signals integrated into your automation. Control valves based on actual product detection, not timers. Enable state-based control.

Typical results:
• 15–20% savings
• Stop draining product down the drain
• Real-time precision vs. estimated timing
• Works with your existing automation 

Features

Every drop counts

Precision, profitability, and measurable results from day one.

Instant Interface Detection

Real-time clarity at every transition. 

Superior Yield

Slash product loss significantly per changeover.

Universal Application

Perfect for opaque, thick, transparent liquids.

Seamless Automation

Effortlessly integrates into your existing system.

Rapid Returns

ROI typically within 12 months or less.
Impact assessment

What European dairy and beverage could recover every year

802M

Litres of product kept from the drain

6.9M

Cubic metres of cleaning water saved

991K

Tonnes of CO₂e avoided

4.4M

Population equivalent of organic load removed

Source: Collo impact assessment, August 2026. About 1,570 European plants: 1,070 dairies processing 50 million litres or more a year and 500+ soft drinks plants (UNESDA).

Case Study: Valio

How a leading dairy producer boosted efficiency and cut hidden losses with Collo

Collo helped Valio’s Joensuu plant achieve significant savings by optimising cream line efficiency and eliminating hidden losses.

FAQ

Frequently asked questions

Answers to the questions we hear most about changeovers and pushouts. If yours is not here, contact us.

How much milk, cream or beer is lost at product changeovers?

More than most plants measure. At every changeover the product and water interface is pushed out on a timer or a flow volume with a margin for error built in, so good product goes to drain before the valve switches and water ends up in product after it. Valio's Joensuu dairy found this on one cream line: with Collo the interface was identified precisely, pushout durations were adjusted, and pushout losses fell by 92%, 260,000 litres a year. The loss calculator gives a figure for your plant. Read the Valio case study.

Why do flow meters, conductivity and turbidity sensors miss the interface?

Flow meters count volume, not what the volume is, so they assume the interface arrives after a fixed quantity. Conductivity responds to ions only, so it says little about the fat, protein or sugar actually in the pipe and cannot separate two products with similar ion content. Turbidity needs particles and a clear line of sight, which opaque and foaming products defeat. The Collo Analyzer reads the complete fingerprint of the liquid, so the interface is found on the product itself in opaque, viscous and foaming liquids alike. Read the comparison guide.

What should happen to the mixed phase?

Minimise it and send it to secondary use, not back into the process. When the interface is detected precisely, the mixed phase shrinks to the physical minimum. What is left can go to a secondary use such as animal feed in dairies rather than to the drain, where it costs money a second time as organic load in wastewater treatment.

How does Collo reduce cleaning downtime between products?

Each changeover is measured, so pushouts and intermediate rinses end when the line has actually changed over rather than when the timer runs out. Collo Insights shows exactly where each product ends and water or the next product begins, with recommendations for tuning the automation. With Collo Signals the interface signal goes into the PLC, so valves switch on the measured state of the liquid. Customers typically save 15 to 20% across changeovers and cleaning.

Does it work for sauces, dressings and other viscous or opaque products?

Yes. The measurement does not depend on light passing through the liquid, so sauces, dressings, syrups, plant-based drinks, cream and cheese milk are read as reliably as clear liquids. It handles product-to-product changeovers as well as product-to-water, which matters on lines that run many recipes a day.

How does changeover detection connect to our automation?

Through Collo Signals over 4-20 mA, Modbus TCP or OPC UA, into your PLC, SCADA or DCS. The control logic stays in your automation and the existing time or flow sequence remains as a fallback. Many plants begin with Collo Insights, use the measured interfaces to adjust their pushout settings, and then move to real-time switching line by line.

What does changeover optimisation typically return?

Payback typically comes within 12 months. Product kept in the tank is the biggest part, followed by lower wastewater treatment charges and less water in product. Collo's impact assessment puts the recoverable product loss at a typical European dairy at about 750,000 litres a year. The loss calculator shows what that means for your volumes and prices.

How long does deployment take, and can it scale across plants?

Two to three weeks from installation to first findings, in a planned maintenance window. Start where the value is: high-flow transfer lines or valuable product such as cream, ideally both. The same analyser, installation and reporting apply on every line and in every plant, so a group can roll it out site by site on one measurement standard.

Contact us

Ready to turn every drop into value?

Connect with our experts now.